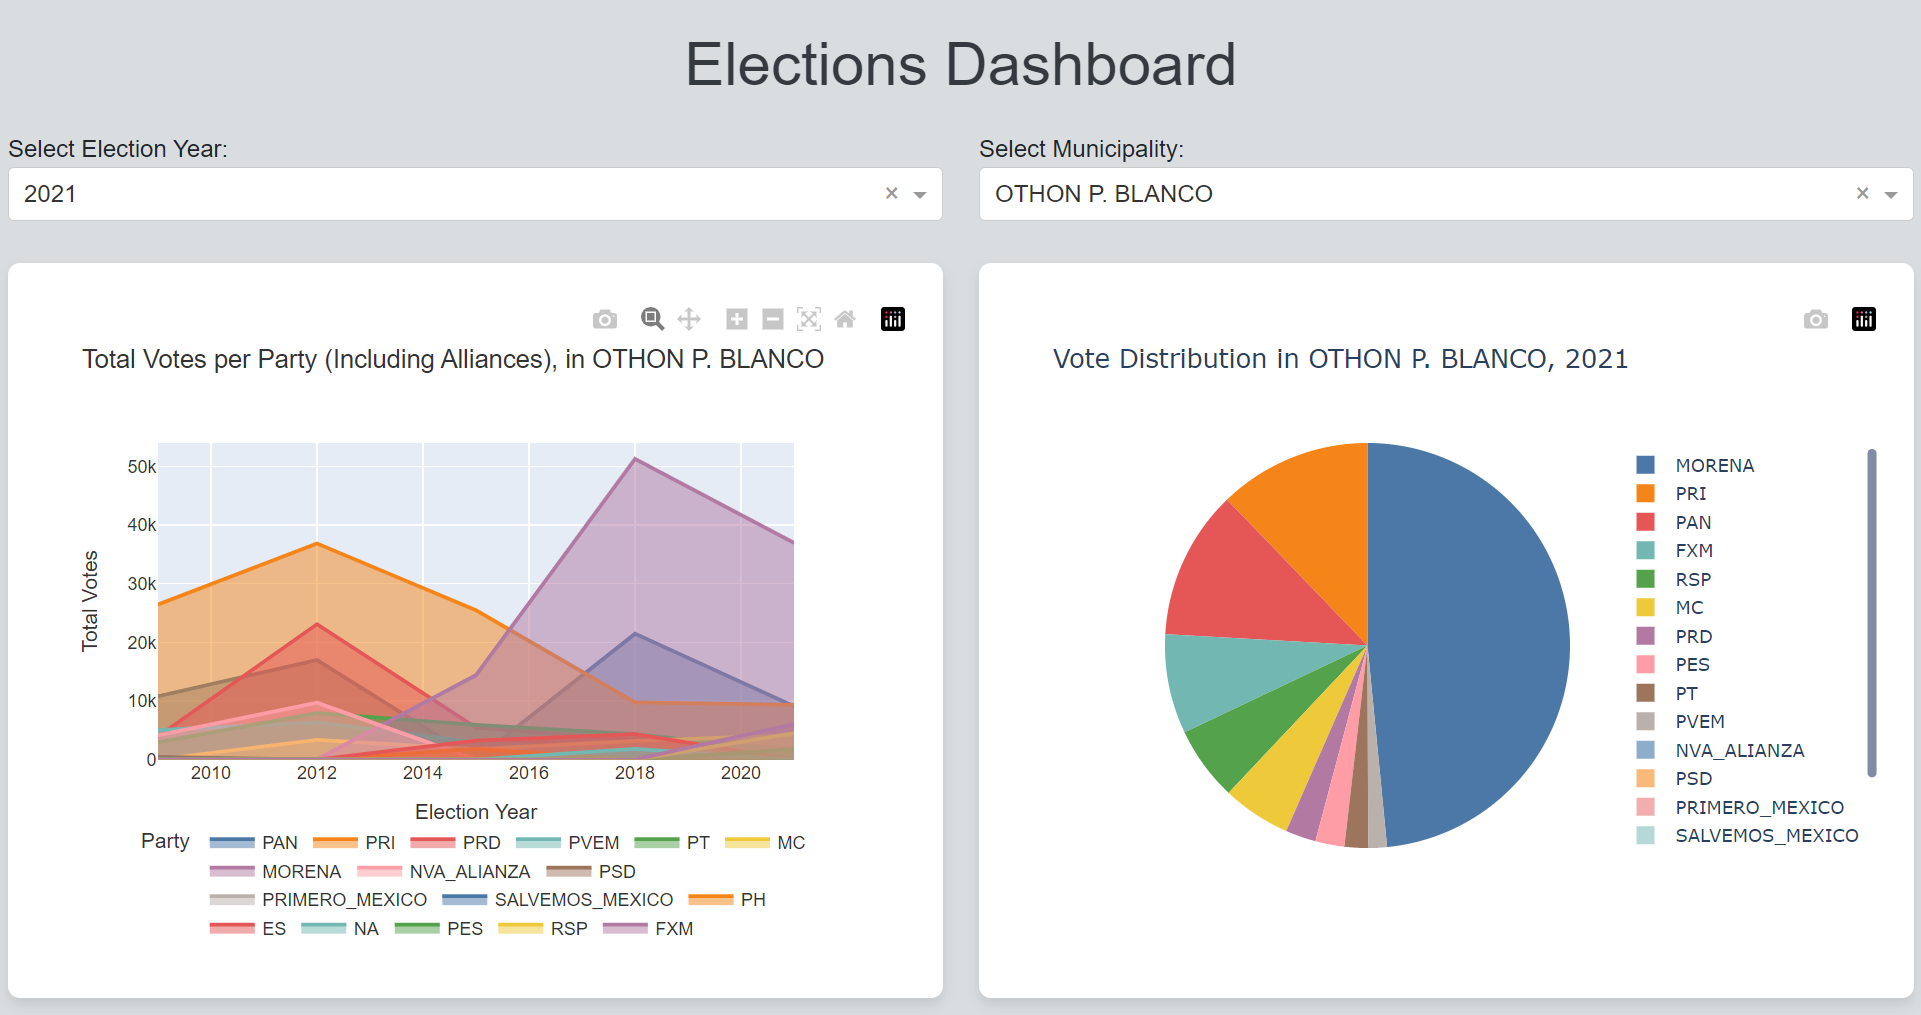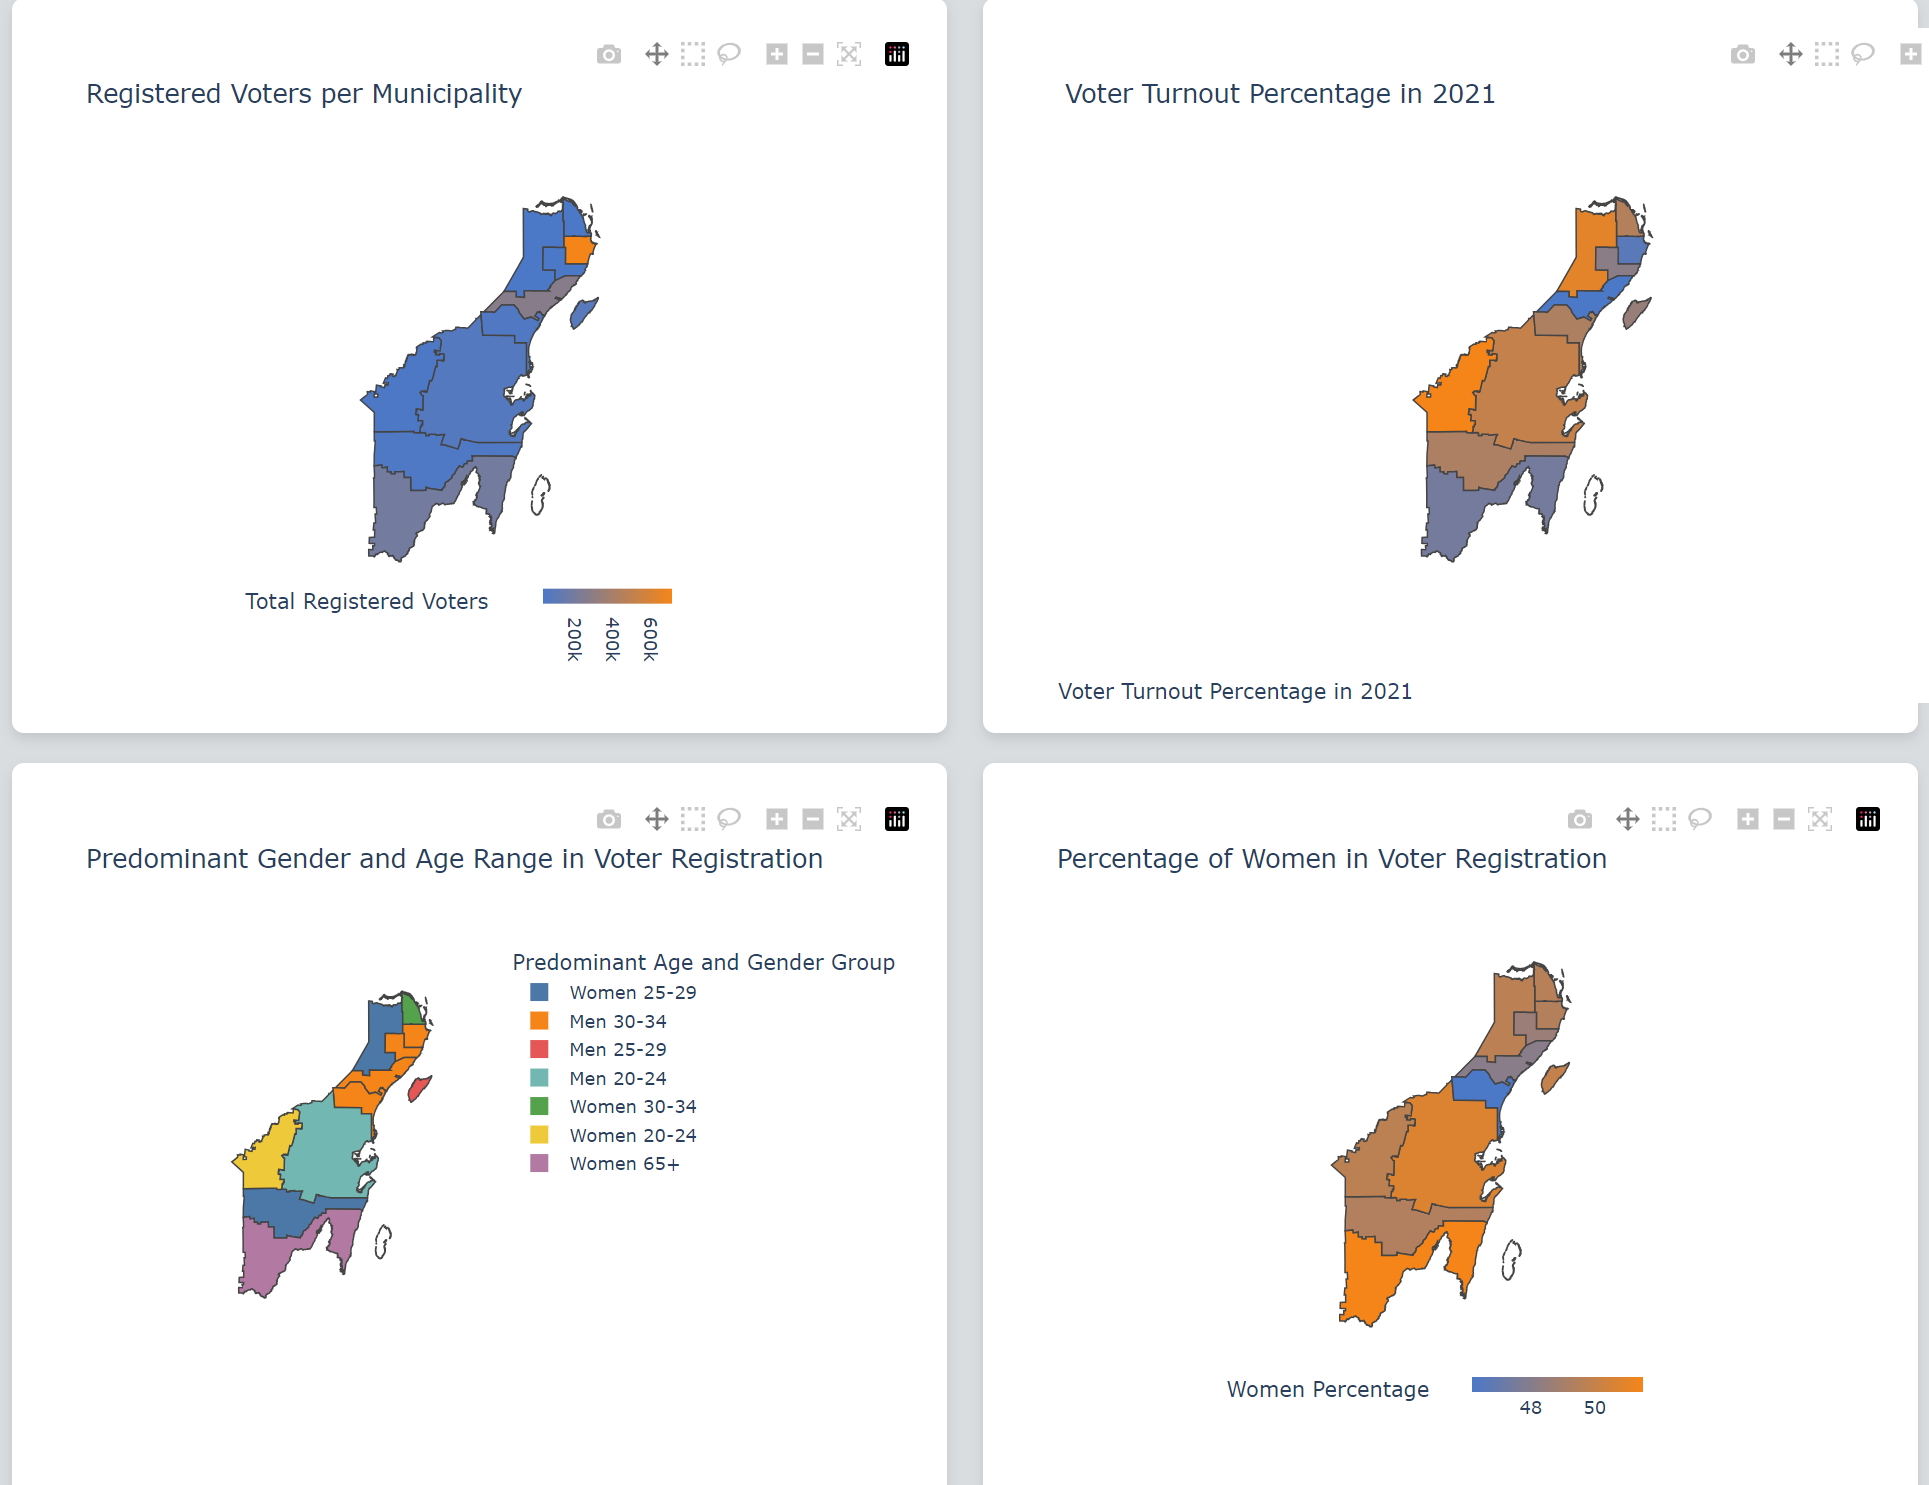
This project showcases the creation of an interactive dashboard for visualizing Mexico’s federal election results, at the State level. Leveraging publicly available data from the Electoral Institute (INE), we employed advanced techniques, including the use of geospatial data to create dynamic maps that visualize voter turnout across regions.
The dashboard allows users to explore voting trends by party and municipality over time, providing actionable insights through clear data visualizations.
Explore the full blog post here and access the live dashboard here.